Articles
/General
Explore the distinct roles of testing and validation in product development, emphasizing their different goals and methodologies.
3 min read
Advertisement
Table of Contents
This article breaks down the key differences between T-tests, F-tests, and Z-tests, all of which are crucial tools in statistical hypothesis testing. We’ll cover when to use each test and what they tell us about our data.
Before diving into the tests, let’s define what a hypothesis is in the scientific context:
The table below highlights the core differences between these three parametric tests:
| Features | F-test | T-test | Z-test |
|---|---|---|---|
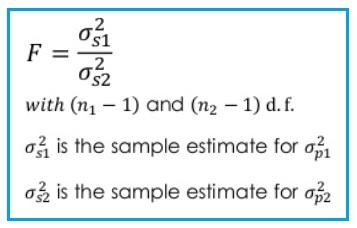
| Application | Comparing variances of two samples | Comparing the mean to a value, or the means of two samples | Same as T-test but for large samples |
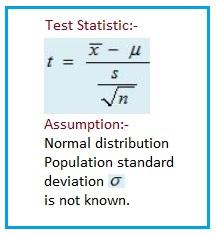
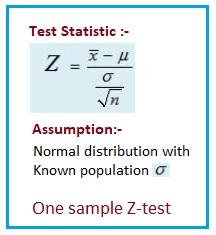
| Used When | 3 or more μs | n < 30 and σ is unknown | n >= 30 and σ is known |
In short, choose the appropriate test based on your data and what you need to compare.
T-tests, F-tests, and Z-tests are fundamental statistical methods used for different types of hypothesis testing:
Choosing the correct test depends on sample size, variance conditions, and whether you are comparing means or variances. Misapplying these tests can lead to incorrect conclusions in statistical analysis.
Advertisement
Related Posts
Articles
/General
Explore the distinct roles of testing and validation in product development, emphasizing their different goals and methodologies.
Articles
/Measurements
Explore the differences between colorimeters and spectrophotometers, their working principles, and when to use each.
Articles
/Software
A comparison of unit testing and integration testing, highlighting their purposes, characteristics, and when to use each during software development.
Measurements
/General
A comparison of AC and DC hipot tests, covering procedures, applications, advantages, and disadvantages.
Advertisement
Articles
/General
Explore the differences between microscopes and telescopes, focusing on their purposes, magnification, and typical applications.
Articles
/General
Explore EMI and EMC testing concepts, standards, and prominent service providers. Learn about radiated and conducted emissions, immunity testing, and more.